
Discover how a Business Intelligence Portal unifies your data, reports, and analytics into one intuitive hub, empowering faster, smarter decisions.
It’s your personal command center, helping you quickly find the insights you need to make smarter decisions. Whether you’re tracking sales, monitoring performance, or exploring trends, this portal brings everything together in a clear and simple way. Ready to unlock the full potential of your business data?
Keep reading to discover how a Business Intelligence Portal can transform the way you work.
What Is A Bi Portal
A Business Intelligence (BI) Portal is a software tool that gathers data from different sources into one place. It helps businesses see, analyze, and use data easily. A BI Portal makes data simple to find and understand. It supports better decisions by showing key information clearly.
This portal acts as a bridge between raw data and business users. It offers tools to explore data without needing deep technical skills. Users can interact with reports, dashboards, and charts all in one spot.
Centralized Data Access
The BI Portal collects data from many systems and stores it centrally. Users get access to all important data through a single login. This saves time and reduces confusion. No need to check multiple places for information. Data is updated regularly for accuracy.
User Interface Features
The portal has easy-to-use screens and menus. It shows visuals like graphs and tables to explain data quickly. Users can customize views to focus on what matters most. Search options help find reports fast. The interface works well on computers and mobile devices.
Integration With Analytics
A BI Portal connects with analytic tools to process data deeply. It supports trends, forecasts, and comparisons. Users can drill down into details for better insights. The portal can also send alerts for important changes. This makes data analysis faster and more effective.
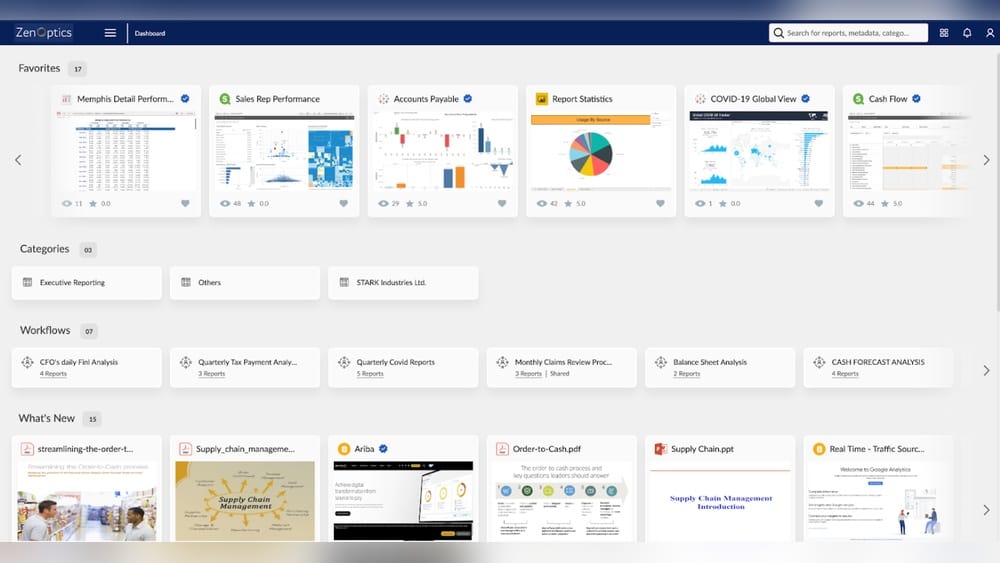
The main dashboard of a BI portal showing key performance indicators and visual reports.
Credit: webfocusinfocenter.informationbuilders.com
Core Components Of Bi Portals
The core components of Business Intelligence (BI) portals form the foundation of effective data management. Each part plays a vital role in turning raw data into useful insights. Understanding these components helps businesses use BI portals efficiently. The main parts include data gathering, data standardization, data analysis, and reporting tools.
Data Gathering
Data gathering collects information from various sources. It pulls data from databases, cloud services, and applications. This step ensures that the BI portal has all relevant data. Accurate data gathering is essential for reliable insights.
Data Standardization
Data standardization organizes collected data into a uniform format. It cleans and corrects errors in the data. This process makes data consistent and easy to compare. Standardized data improves the accuracy of analysis.
Data Analysis
Data analysis examines the standardized data to find patterns and trends. It uses algorithms and statistical methods to interpret the data. This component helps identify opportunities and risks. Good analysis leads to better business decisions.
Reporting Tools
Reporting tools display the results of data analysis in clear formats. They create charts, dashboards, and reports for easy understanding. These tools allow users to explore data visually. Effective reporting helps share insights across the organization.
In practice, the quality of each component directly affects the portal’s usefulness. A common mistake is skipping the standardization step, which leads to inconsistent metrics across departments. Taking time to align data definitions upfront saves hours of troubleshooting later. Many teams also underestimate the volume of data sources — a typical enterprise can pull from CRM, ERP, marketing automation, and external APIs. Planning for that variety from the start makes the architecture more resilient.
Understanding the underlying architecture of such platforms helps teams design components that work together smoothly, reducing integration friction.
Benefits Of Using Bi Portals
Business Intelligence (BI) portals offer many advantages for companies of all sizes. They centralize data, making it easier to access and understand. These portals support faster and smarter decisions by presenting clear insights. They also simplify how reports are created and shared across teams.
Using a BI portal improves how businesses handle data and make choices. It helps users see the full picture quickly. This leads to better planning and problem solving. Below are key benefits of using BI portals in any organization.
Improved Decision Making
BI portals provide real-time data that helps leaders act quickly. They show trends and patterns in simple dashboards. This clarity reduces guesswork and errors. Teams can base decisions on facts, not assumptions. Faster decisions keep businesses competitive and responsive.
Enhanced Data Visibility
All important data is gathered in one place. Users can access information from different departments easily. This broad view uncovers hidden opportunities and risks. Transparency improves collaboration and trust among teams. Everyone works with the same accurate data.
Streamlined Reporting
BI portals automate report creation and distribution. Reports are consistent, reducing manual work and mistakes. Users get updates instantly without searching for data. This saves time and effort for analysts and managers. Reports become more useful and timely for business needs.
User Empowerment
BI portals allow users to explore data on their own. They can create custom reports without IT help. This independence speeds up problem solving and innovation. Employees feel more confident using data in daily tasks. It builds a data-driven culture across the company.
Beyond these four pillars, a well-implemented BI portal also reduces time spent reconciling spreadsheets. In many small and mid-sized businesses, employees waste hours each week manually combining reports from different departments. A portal eliminates that duplication, giving teams back valuable time for strategic analysis. For example, a sales manager can immediately see how lead conversion rates correlate with marketing spend — without emailing the marketing team for a file. This cross-functional visibility is where BI portals deliver their highest ROI.
One effective way to deepen this culture is to start small: choose one department to pilot the portal, then expand based on feedback. Teams that feel ownership over their dashboards adopt the tool much faster. AI-powered tools for smaller teams can also help non-technical users build meaningful visualisations without needing a data analyst.
Popular Bi Platforms And Tools
Popular Business Intelligence (BI) platforms and tools help businesses collect and analyze data. They provide clear dashboards and reports. These tools support decision-making by showing key information quickly.
Each BI platform offers unique features. Some focus on deep data analysis, while others simplify visualization or reporting. Choosing the right tool depends on a business’s needs and size.
Sap Businessobjects
SAP BusinessObjects is a classic BI tool for large enterprises. It offers strong reporting and data visualization options. Users can create detailed reports to track business performance. It integrates well with other SAP systems.
Sisense
Sisense is known for embedded analytics. It allows businesses to add data insights inside their apps. The platform handles large data sets easily. It has a simple drag-and-drop interface for building dashboards.
Domo
Domo focuses on basic data analysis and visualization. It is user-friendly for people with little technical skill. The platform connects to many data sources automatically. It offers real-time data updates for quick decisions.
Qliksense
QlikSense is strong in data exploration. Users can interact with data freely and find trends. It uses in-memory technology for fast processing. The tool supports self-service analytics for business users.
Yellowfin
Yellowfin offers easy-to-use data visualization tools. It helps teams create reports and dashboards quickly. The platform supports collaboration and storytelling with data. It suits businesses needing simple, clear insights.
Oracle Analytics
Oracle Analytics streamlines workflows with powerful AI features. It combines data from multiple sources into one view. The platform provides smart data preparation and visualization. It helps businesses automate routine analysis tasks.
Implementing A Bi Portal
Implementing a Business Intelligence (BI) Portal requires careful planning and clear understanding. It helps companies make data-driven decisions by centralizing reports and analytics. A well-implemented BI portal improves data access and collaboration across teams. The process involves assessing needs, selecting the right platform, solving data integration issues, and training users effectively.
Assessing Business Needs
Start by identifying what your business requires from a BI portal. Determine the key questions that data should answer. Understand who will use the portal and what reports they need. This step ensures the BI portal supports real business goals. Clear needs help avoid building unnecessary features that waste time and money.
Choosing The Right Platform
Select a BI platform that fits your company size and budget. Check if it supports the data sources your business uses. Look for user-friendly interfaces that non-technical staff can navigate. Consider platforms with strong security and scalability. The right platform makes it easier to maintain and grow your BI portal over time.
Data Integration Challenges
Integrating data from different systems can be difficult. Data may be stored in various formats and locations. Cleaning and standardizing data is necessary to ensure accuracy. Plan for regular updates to keep data current. Overcome these challenges to provide reliable insights through your BI portal.
User Training And Adoption
Train users to maximize the BI portal’s benefits. Offer simple guides and hands-on sessions. Encourage feedback to improve the system continuously. Support users in learning how to find and interpret data. High adoption rates increase the portal’s impact on business decisions.
A practical approach is to build a small proof-of-concept with real data before rolling out company-wide. This reveals integration pain points early and gives users a chance to influence the design. For example, you might discover that sales wants weekly snapshots while finance needs daily updates — a single portal can serve both if the scheduling is configured correctly from the start. Also, designate a “portal champion” in each department who can answer peer questions and share tips. This organic support network often drives adoption far better than top-down mandates.
If you are just getting started, the lead generation process in your CRM is often the easiest first dataset to feed into the portal because it already has structured fields and regular update cycles.
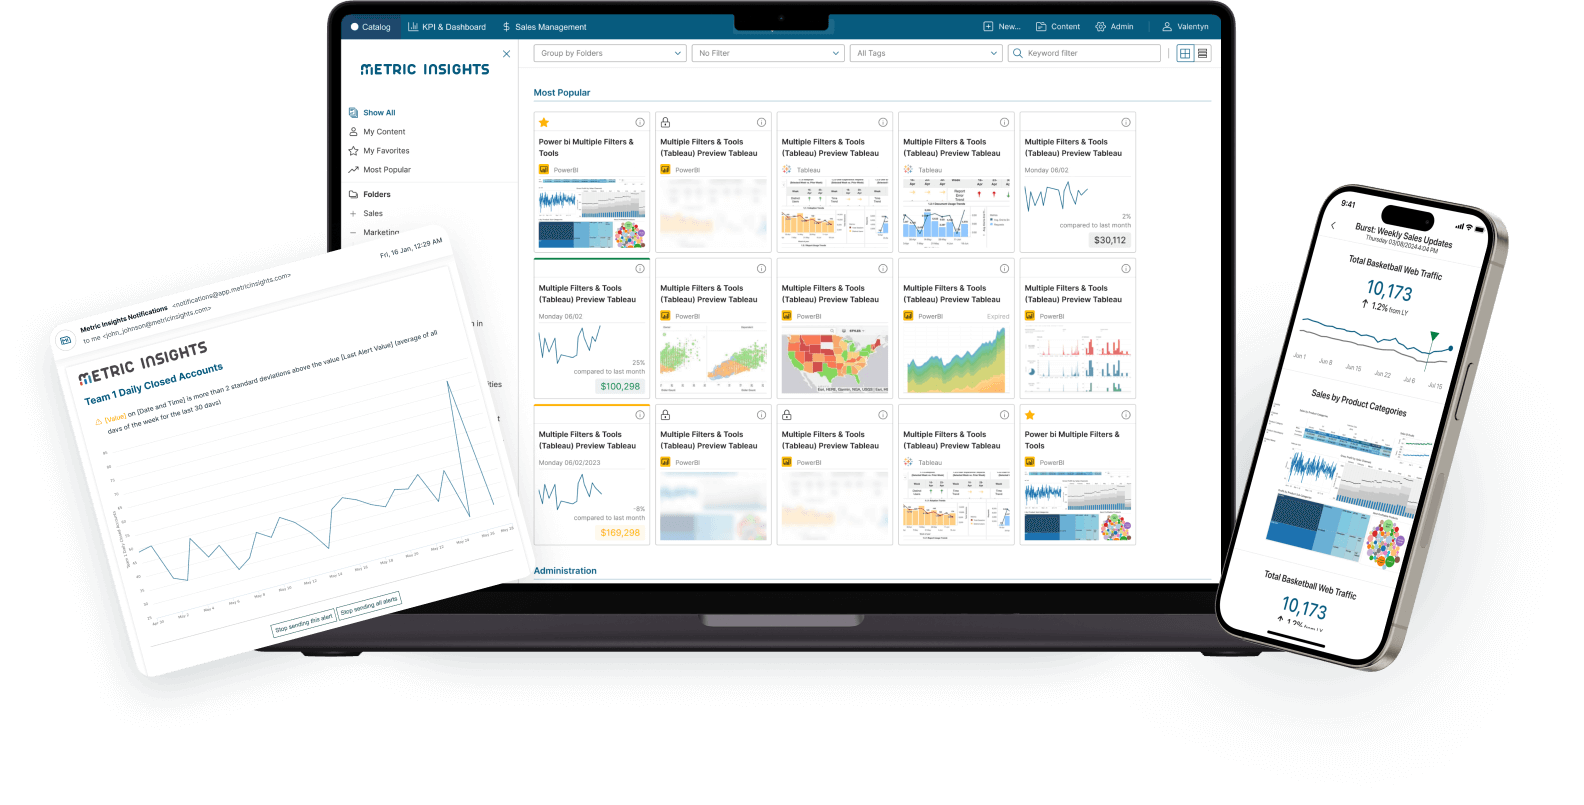
A visual roadmap showing the key stages of implementing a BI portal in an organisation.
Credit: www.metricinsights.com
Real-world Bi Portal Applications
A Business Intelligence (BI) Portal serves as a central hub for data access and analysis. It connects users to vital information across an organization. Understanding real-world BI portal applications helps businesses see their true value. These portals simplify data use and improve decision-making.
BI portals have many practical uses. They support reporting, analytics, compliance, and customization. Each function helps teams work smarter and faster.
Enterprise Reporting
BI portals streamline enterprise reporting by gathering data from multiple sources. They create clear, consistent reports for all departments. This reduces errors and saves time. Managers get accurate insights quickly. Reports can be scheduled or accessed on demand. This keeps everyone informed and aligned.
Embedded Analytics
Embedded analytics places data insights inside business apps. BI portals allow users to view charts and dashboards without switching tools. This improves workflow and user experience. Teams can analyze data right where they work. It helps spot trends and make faster choices.
Governance And Compliance
BI portals support governance by controlling who can see and edit data. They track data use to meet compliance rules. This reduces risk and ensures data security. Access rights and audit trails help maintain trust. Businesses stay aligned with laws and internal policies.
Custom Dashboards
Custom dashboards let users tailor data views to their needs. BI portals offer drag-and-drop tools for easy setup. Dashboards show key metrics clearly and visually. This helps users focus on what matters most. Custom views improve data understanding and team productivity.
For governance specifically, many organisations overlook the importance of row-level security. A sales director in Europe should not see North American commission data unless explicitly granted. Modern BI portals support these fine-grained permissions, which is critical for industries like healthcare and finance where regulations such as GDPR or SOX apply. Conducting a quarterly audit of who has access to what reports helps maintain compliance without slowing down daily work.
To learn more about keeping your data secure while enabling broad access, review how operational BI workflows integrate permission controls into everyday analytics.
Future Trends In Bi Portals
The future of Business Intelligence (BI) portals is bright and full of innovation. These portals are evolving to meet growing business needs. Companies require faster, smarter ways to handle their data. New technologies are shaping how BI portals function and deliver insights.
BI portals will become more intuitive and powerful. They will support better decision-making. Let’s explore some key trends that will define the future of BI portals.
Ai And Machine Learning Integration
AI and machine learning will play a bigger role in BI portals. These technologies help analyze data automatically. They identify patterns and predict future outcomes. Users get smarter insights without extra effort. This makes data analysis faster and more accurate. AI-powered BI portals will guide users to key findings.
Enhanced Data Visualization
Data visualization will improve greatly in BI portals. New tools will create clearer and interactive charts. Users can explore data visually and understand it quickly. Visuals will adapt to user needs and devices. Enhanced graphics will make data stories easier to follow. This helps users spot trends and outliers fast.
Mobile Bi Access
Mobile access to BI portals will become standard. People want to check reports anytime, anywhere. Mobile BI apps will offer full portal features on phones and tablets. This keeps teams connected and informed on the go. Mobile BI boosts productivity and speeds up decisions. Accessing data outside the office will be seamless.
Cloud-based Solutions
Cloud technology will dominate BI portal hosting. Cloud-based portals offer flexibility and scalability. Companies can expand their data needs easily. Cloud solutions reduce IT costs and simplify maintenance. They allow real-time data updates and collaboration. Cloud BI portals support remote work and global teams effectively.
By 2026, most BI portals already include natural-language query (NLQ) — users can simply type “show me sales by region last quarter” and the portal generates the appropriate chart. This reduces the learning curve even for casual users. Another growing trend is “data storytelling,” where portals automatically annotate key changes in metrics with plain‑language explanations. For example, instead of just a line chart, the portal might say “Revenue dropped 8% in February due to a decline in the APAC region.” This kind of built-in intelligence helps managers focus on the story behind the numbers rather than hunting for it themselves.
For teams that want to stay ahead, predictive model training is becoming a practical skillset — even non‑data-scientists can use portal‑integrated ML tools to forecast inventory or customer churn.
A mobile BI portal dashboard showing the same data and interactivity as the desktop version.
Credit: intelisenseit.com
Read More : Business Intelligence Reporting: Turn Data into Actionable Insights
Best Practices for BI Portal Success
A BI portal is only as effective as the practices surrounding it. To get the most out of your investment, follow these proven guidelines.
Define Clear Success Metrics
Before launch, decide how you will measure the portal’s impact. Common metrics include report adoption rate (percentage of employees who log in monthly), time saved on report creation, and reduction in spread‑sheet errors. Track these quarterly and adjust features based on what users value most.
Keep Data Fresh and Trusted
Stale data undermines confidence. Schedule automated refreshes at least daily for operational reports and hourly for time‑sensitive dashboards. Add a “last updated” timestamp to every report so users know the data is current. If a source system is down, display a clear notice rather than showing outdated numbers.
Design for the Least Technical User
Your BI portal will serve executives, analysts, and front‑line staff. Structure the layout so a new user can find the most common reports in two clicks. Use consistent naming conventions (e.g., “Sales Pipeline,” not “SP_0321”). Avoid jargon in menus. Provide a quick‑start video tour embedded on the login page.
Establish a Feedback Loop
Create a simple form or dedicated channel where users can request new dashboards, report bugs, or suggest improvements. Review these inputs monthly. A portal that evolves with its users remains relevant and sees higher sustained adoption.
For a deeper look at how to structure data pipelines that support these practices, explore the underlying architecture of such platforms we mentioned earlier.
Common Mistakes to Avoid
Even well‑funded BI portal projects can stumble. Here are the most frequent pitfalls and how to sidestep them.
Ignoring Data Quality Upfront
Porting dirty data into a beautiful dashboard only amplifies errors. A common mistake is assuming the source system is clean. Always run a data quality audit before the portal goes live. Deduplicate records, standardise date formats, and flag missing values. This upfront work prevents “garbage in, garbage out” scenarios.
Overloading Dashboards with Metrics
Stakeholders often want every possible metric on one screen. The result is a cluttered dashboard that confuses rather than clarifies. Instead, limit each dashboard to five to seven KPIs aligned to a single business objective. Provide drill‑down links for deeper analysis rather than cramming everything into one view.
Neglecting User Training After Launch
A single training session is rarely enough. Users forget features after a few weeks. Plan follow‑up workshops focused on specific use cases — for example, “How to build your own forecast chart” or “Using filters to compare regional performance”. Record and archive these sessions so new hires can catch up independently.
Choosing Platform Before Requirements
Starting with a fancy platform and then trying to fit it to business needs is a costly mistake. Always complete the needs‑assessment step first. A mid‑range tool that matches your workflows will outperform an enterprise platform that forces you to change how you work.
If you are evaluating platforms, comparing types of machine learning algorithms integrated into modern BI tools can help you decide which vendor offers the predictive capabilities your business actually needs.
Frequently Asked Questions
What Are Business Intelligence Portals?
Business intelligence portals offer a single interface for users to access, analyze, and interact with all enterprise analytics and reports. They streamline data discovery and support informed decision-making across organizations.
What Is A Business Intelligence Platform?
A business intelligence platform is software that collects, analyzes, and visualizes data. It helps businesses make informed decisions quickly.
What Are The 4 Concepts Of Business Intelligence?
The four concepts of business intelligence are data gathering, data standardization, data analysis, and reporting. These steps enable informed decision-making.
What Is The Best Ai Tool For Business Intelligence?
The best AI tool for business intelligence depends on needs. Top options include SAP BusinessObjects, Sisense, Domo, QlikSense, Yellowfin, and Oracle Analytics. Each excels in reporting, embedded analytics, data analysis, exploration, visualization, or workflow streamlining. Choose based on your business goals and data complexity.
How long does it take to implement a BI portal?
A typical implementation for a mid‑sized company takes eight to sixteen weeks, depending on the number of data sources and the complexity of reports. Planning, data integration, and user acceptance testing each account for about a third of the timeline. Cloud‑based portals tend to deploy faster than on‑premises solutions because infrastructure is already provisioned.
Can a BI portal work with legacy systems?
Yes, most modern BI portals include connectors for older database systems such as IBM DB2, Oracle, and even flat files. The key is to assess whether the legacy system supports scheduled exports or API access. If not, a lightweight ETL process can extract the data into a staging area before loading it into the portal.
What is the typical cost of a BI portal?
Costs vary widely. Open‑source portals (like Apache Superset) have no licensing fees but require technical staff to set up and maintain. Commercial cloud platforms start around $20‑$50 per user per month for basic features and scale to several thousand dollars per month for enterprise plans with advanced AI and governance. Always factor in training and data preparation costs, which can exceed the software subscription itself.
Conclusion
A Business Intelligence Portal makes data easy to find and use. It brings all reports and analytics into one place. Teams can make decisions faster with clear, organized information. The portal helps businesses track progress and spot trends quickly. Everyone in the company can access the data they need.
This tool supports smarter choices and better results. Using a BI portal keeps your data simple and useful. It is a key part of modern business success.
Ready to transform your data into a competitive advantage? Start by evaluating a portal that fits your scale — and leverage data for business growth with a unified analytics hub tailored to your team.

